|
7/16: Physics Basics:
Take home points:
In depth Notes:
Sound above 20k Hz. We use 1-15 MHz. Image is made by sound bouncing off of tissues. - Waves: come in cycles. o Frequence (in MHz) is how many cycles per second o Length is distance of cycle (m) o Due to time, shorter lengths make high frequency and vice versa o Propagation velocity (phi) is c/f - Material properties: (K) bulk modulus (how compressible it is) as the BM goes up, then so does bulk modulus. - Ro is density. Mass per volume. This is inversely proportional to propagation velocity o Dense tissues will not let waves travel well through them. The probe - How do you make the waves? You send electricity through the housing, then through the piezoelectric crystals which vibrate and make waves. The acoustic lens and match layer focus them. - Piezoelectric crystals when electricity is applied to them, they deform (change shape) and this displaces some of the electrodes making a charge w/ positive on one side and negative on other. The charge can make energy. o This powers lighters, electronic drums, ink jet printers. o In ultrasound the charge we make gets turned into a sound wave. o Our probes can receive and emit the waves - Attenuation o As waves move through a tissue, the amplitude (intensity) of the wave lessens making the image less refined. o Attributers
o What makes us able to use ultrasound. This is when a fraction of emitted waves returns to the probe to make the images. o Some go directly back to the probe, but not all. Some - Refraction When the waves go through the tissue and bends and continues traveling through the tissue. o The change in the speed of the wave changes as it goes through changes due to density of the tissue increasing making the wave change velocity. - These are dependent on acoustic impedance. This is how a sound moves through a medium (propagates). It is relative to the density of the fluid and speed of sound in the medium (Z = ro c) o This is notable when you have 2 structures w/ 2 different properties abutt (bone and soft tissue) this is when you have acoustic impedance mismatch. o Impedance is increased w/ density, bulk modulus. - Reflection is noted when you have tissues w/ very different acoustic impedances. This is what makes them appear bright (when the impedance is seen on surface of the bone) - Refraction is when there’s a difference of impedance, but not the massive dramatic change. This is when you have tissues w/ a curve. - Final tissue loss is scattering: o When there is a particle that is smaller than the wavelength of the tissue you’re talking about. This has the signal dissipate in the tissue. - These drive the creation of Artifacts o Posterior shadowing: the waves hit high attenuation tissues so you can’t see through them (bones, stones) o Posterior enhancement: waves pass through low attenuation tissue. This gets more waves through the initial fluid, so the second tissue gets more energy in it making it appear brighter (see in tissue behind fluid filled sacs) o Reverberation: when the echoes reverberate. This is a highly reflective structure (pleural line) that keeps sending signals back to the probe w/ different depths. You see this in needles too. o Mirror artifact: when you have high reflection tissue. Waves hit the highly reflective tissue (diaphragm) o Edge: highly refractive tissue makes lines at the edges. See this in vessels when you hit the structure w/ curved edge, and no echoes come back to them bouncing off. Beam properties: o The probe: electricity goes into the probe, hits the backing, vibrates the crystals to make waves, then matches them in a similar direction, then the Lens focuses the beam. o Linear array: sequential firing down the beam. This is done in a linear pattern. Each goes out and comes back in a perpendicular pattern.
o properties of the waves emitted from the probe § When probes fire, it will be wide, then narrow to a focus point, then broaden out again. § Focus: point where beams converge. § Near field (Fresnel zone): close to field. Waves converging and thus your resolution and clarity is better § Far field (Fraunhofer zone): opposite. Spacing of waves is reduced and see poor image resolution. § Focal zone: best resolution § Probe and focal zones: small footprint means the beam narrows and short focus. A larger footprint allows broader space and more time before the wave disperse. Frequency of probe also contributes. · High frequency probes have a closer near field. Where curves have broader nearfields. o Note, most of this is about the main beam. However, there are also other beams. § Side lobes: Side beams. On the edges and they make artifacts. When the crystals get charged, they get longer and thus it has more area that sends off these side lobes. § Grating lobe: even more off the sides. - Artifact: o Side lobes: the probe takes the side lobes waves back and transpose onto the main image. Can fan through side lobes. § This can make stuff look present that isn’t there § Tends to have more linear appearances. Don’t respect anatomical boundaries o Beam width this is based on that the beam sends out waves that are diverging after the focal zone. Looks like a hazy abnormality. Can adjust the focal zone to address.
o Get the right focal zone. Have the object in this area. o Minimize far field o Optimize gain: this is a pre-processing tactic. Does not change the tissue, but instead changes the display. § Time gain compensation: this is where you can change gain at different gains at different points along the tissue. Less stuff is going to the deeper tissues, so you try increasing the deep image areas. o Tissue harmonic imaging: when you get waves back that you sent out AND from the tissues. Can be helpful in deep structures.
o TI: Thermal index. This is related to intensity, duration, and absorption of the wave. Need to be aware of this. § Continuous wave doppler (because you give it constantly you have a high risk of it). o MI: mechanical “shaking” of tissues. Risk of making a cavity from popped bubbles. We want MI low to keep people safe. When you make this high, you make holes or pop hollow tissues. - ALARA: want the POCUS waves to be used at levels as low as reasonably achievable. Didactics 7/23 Take home points:
Vascular Access Revolution: The impact of Ultrasound. - Discuss the literature on vascular access via POCUS - Evidence dating from the late 90’s that if you don’t use ultrasound for vascular access of difficult patients, you are harming the patient. - Complications are often from consultants putting in lines w/o POCUS, often after a miss. These are where you see AV fistula or other complications. POCUS guided IJ:
- Seems simple. Can see it press the IJ or o Evidence. o 3 RTC studies. Milling ’05, Leung ’06, Karakitos. Looked at complications and found much less likely for carotid puncture, unsuccessful cannulation, hematoma, pneumothorax. Leung was Australian study and did w/o ultrasound trained people (unlike Milling) showing 15.4 less unsuccess, 7.7 less hematoma, 5 less carotid, 1.5 for pneumo (all ARR) o So, 10-30% decrease in harm w/ US guided IJ Subclavians: looked at blind subclavian vs US guided and massive harm reduction w/ US. Study broke this by expertise and even high experience providers had greater complications w/ blind insertion vs POCUS. o Even if you’re great at blind SC, you likely haven’t done enough to fail. o US guided subclavian: § Can do! § Put on the clavicle, then slide laterally, in a long axis, then you need to disassociate from the clavicle. And rotate the axis to look at the vessel in a long axis. § In live studies, you may have an external jugular joining a larger subclavian and may see a valve where it joins. § Veins also can look like have bulbs § Can do it in a short axis too. · Use doppler to confirm which is the artery and vein and memorize which is the correct one by nearby structures. Can also do color but pulse wave doppler is better. § Vezzani looks at infraclavicular cannulation of the subclavian vein in cardiac surgery patients. Long vs short axis. Found the short axis did better. § Subramony looked at ultrasound guided vs landmark method for subclavian vein in the ED and when educated, found in 2022 that US guided was better. Found 60% landmark and 70% w/ US in subclavian. § Supraclavicular looks that if you can jam the probe in there near sternum, then you can see the subclavian joining the brachiocephalic § Can use the endocavitary in this area and in suprasternal notch. · Also found an article that when you insert the guidewire, the direction of the J tip on the wire will send the line where it needs to go, so point it towards the feet. - PIV: o AEUS chairmen found in 2014 that routine PIV US guided not strongly supported o But then found US guided PIV found on patient survey found that they were discharged home vs getting a central line due to no access. And had higher satisfaction. o We noticed that central venous placement drops off as more PIVs are done. Noted in 2012 at Thomas Jefferson by Arthur Au - Shokoohi found ultrasound guided PIV made CVC use drop off logarithmically. - Do Echo-enhanced needles make a difference in access? Turns out not a huge difference except that does prevent double wall (back walling) - Peds: ultrasound had higher success than landmark. - Key of all these: stay on target. Do not bring your probe to the needle but bring the needle to the probe. o Learners struggle when they have to manipulate the needle and the probe. 7/30 – DVT
0 Comments
Hello Wash U Pocus community!
Welcome to the new academic year! We hope all our new learners are settling in well and that your year is off to a great start. The Ultrasound Division has been busy kicking things off, with Kelly and I (Courtney) starting as the new fellows and helping to welcome our incoming interns during bootcamp. Below are two articles we discussed during our recent journal club and a few take home points for each. Eke OF, Shokoohi H, Serunjogi E, Liteplo A, Haberer JE, Jung OS. Barriers and facilitators to point-of-care ultrasound use in an academic emergency department by perceived usability. Am J Emerg Med. 2025 Feb;88:105-109. doi: 10.1016/j.ajem.2024.11.056. Epub 2024 Nov 23. PMID: 39612527. This study used structured quantitative surveys to determine barriers and facilitators to the use of POCUS in an academic emergency department. Participants were divided into groups based on perceived ultrasound utility (high, medium, low) and training (resident, attending, APP). 29 interviews were analyzed divided based on perceived POCUS utility. The barriers identified included perceived insufficient bedtime time to conduct the POCUS study, the need for additional studies when POCUS was inconclusive, lack of confidence and/or training in POCUS use/applications/interpretations, and unfamiliarity with machines. Facilitators identified included POCUS aiding in clinical decision making, supervision for trainees, and machine availability/functionality/user friendly interface. The barriers were consistent across participants, with the lack of education being noted particularly by senior faculty, APPs and residents. This study was overall well performed especially in consideration of a survey study where participation can be limited and bimodal in response. As this was conducted in an academic institution, performing a similar study in a community/RVU based setting could help elucidate common trends or unique factors in that clinical setting. Skitch S, Vlahaki D, Healey A. Quantifying Clinically Meaningful Point-of-Care Ultrasound Interpretation Discrepancies Using an Emergency Department Quality Assurance Program. Cureus. 2023;15(7):e42721. Published 2023 Jul 31. doi:10.7759/cureus.42721 A 2023 study evaluating a Point-of-Care Ultrasound (POCUS) Quality Assurance (QA) program in a Canadian academic Emergency Department (ED) found remarkably low rates of interpretation discrepancies. Out of 2,668 POCUS examinations reviewed over a year, only 1.4% contained an interpretation discrepancy, and 0.5% of all scans had a clinically meaningful discrepancy, meaning an error that altered patient care. The study also revealed that scans performed by non-expert sonographers (no formal ultrasound training) were significantly more prone to discrepancies compared to those performed by experts (3.4% vs. 1.1%). No specific scan type showed a higher discrepancy rate. This rate is comparable to quoted radiology literature, with clinically significant plain radiograph discrepancies being 0.95%. These findings provide strong reassurance regarding the diagnostic accuracy of ED POCUS! Courtney Smith, MD Clinical Ultrasound Fellow Congratulations to our ultrasound of the month winner for February, Dr. Alex Varasteh! Dr. Varasteh identified a case of cardiac tamponade and correctly applied his POCUS skills to obtain all of the key ultrasonographic elements to make this life saving diagnosis. In addition to having a pericardial effusion, there are three major echocardiographic signs indicative of cardiac tamponade: Chamber collapse, Inflow velocity respiratory variation, and a plethoric IVC.
2. Inflow Velocity Variation: When blood flows into the RV during diastole there is limited expansion of the cavity due to the reversal oftransmural pressure gradients (RV early diastolic collapse). This leads to decreased RV filling and subsequent decreased LV filling and drop in stroke volume This is the cause of the classic clinical feature of cardiac tamponade known as pulses paradoxus- a decrease in systolic BP > 10 mmHg on inspiration. Just as volumes decrease, so do velocities. These velocities can be measured with ultrasound by using pulse-wave doppler. Tips for measuring mitral valve inflow variation: Place the doppler gate at the tips of the mitral or tricuspid valve leaflets in the apical 4 chamber view. Slowing the sweep speed can make it easier to visualize the respiratory cycle. Measure the fastest and slowest peak velocities and compare thevalues. Mitral valve flow variation >30%, or tricuspid flow variation >60% are indicative of cardiac tamponade.
Author: Arthur Forbriger
Editor: Allison Zanaboni Congratulations to the winners of the November and December ultrasounds of the month, Drs Daniels and Kopischke! Check your mail boxes next week for a Kaldis gift card. Dr. Daniels used her POCUS skills to identify a case of pyelonephritis with developing renal abscess, and Dr. Kopischke detected a classic case ofhydronephrosis with intrarenal stones. Pyelonephritis Ultrasound findings in acute pyelonephritis are often normal. In severe or chronic infections you may see pelvic wall thickening (Image 1,black arrow) or hypervascularity identified using color doppler. POCUS is more useful in identifying complications including emphysematous pyelitis and renal abscess. Emphysematous pyelitis is caused by gas forming bacteria and will have areas of hyperechogenicity within the renal parenchyma with classic “dirty shadowing.” Renal abscess will appear as well circumscribed hypoechoic areas with internal septations (image 2, black circle) Nephrolithiasis and Hydronephrosis The primary application of renal POCUS is to evaluate for obstructive uropathy by identifying the presence or absence of hydronephrosis. Hydronephrosis can be graded from mild to severe depending on the amount of dilation of the collecting system( Image 1). A common clinical indication for renal POCUS is diagnose and grade the degree of hydronephrosis in renal colic. Depending on your pretest probability, you can forgo unnecessary CT scans and urology consults which in turn can decrease ED LOS. One proposed algorithm is listed below (Image 2). You can occasionally identify intrarenal stones which appear as hyperechoic foci within the collecting system with posterior shadowing (Image below) Author: Arthur Forbriger
Editor: Allison Zanaboni
“Mac on” vs “Mac off” “Mac on” refers to when the retina is still attached to the macula. This is an ophthalmologic emergency since there are much better visual outcomes if repair can be done prior to progressing to a “Mac off” detachment. The macula is located temporally to the optic nerve, so if you see the retina attached in this region, the patient should get an urgent ophthalmology consult. “Mac off” retinal detachments, as in this case, are less urgent since visual outcomes are similar despite timing of surgery. However the patient should have ophthalmology follow-up as these all typically require repair. Tips for scanning the Eye
Author: Arthur Forbriger
Editor: Allison Zanaboni Dr. Winkels diagnosed a molar pregnancy on ultrasound. Note the 'cluster of grapes' or 'snowstorm appearance' within the uterus that is typically described. Another finding in these images are the bilateral enlarged, cystic ovaries. This is referred to as Hyperreactio Luteinalis, and is associated with significantly elevated bHCG (this patient >770, 000) and is seen in approximately 25% of patients with molar pregnancies.
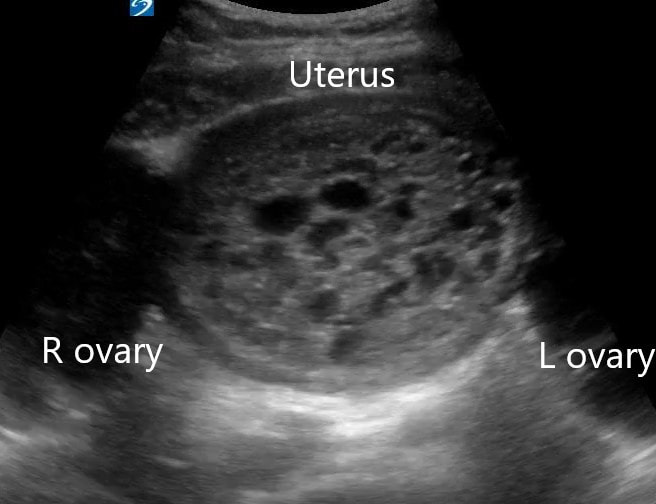
 Dr. Lamb picked up on free air from a perforated gastric ulcer in a patient who presented with severe abdominal pain. Note the thin hyperechoic stripes (arrow) with posterior acoustic shadowing (star). In the clip there is also a small amount of free fluid adjacent to the free air.
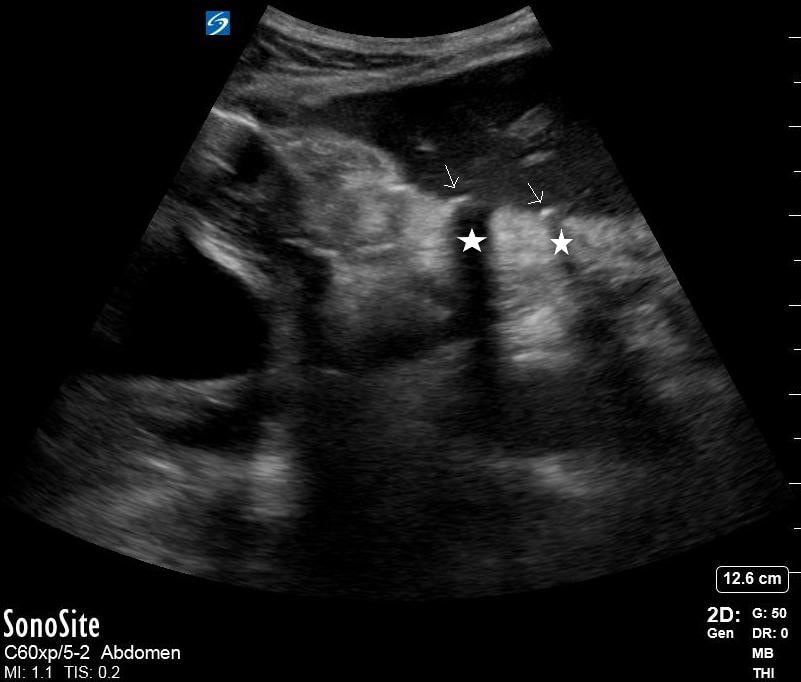
Dr. Lew diagnosed Aortic Valve endocarditis on a patient who presented with vague symptoms and generalized weakness. Her POCUS diagnosis resulted in a complete change in patient management and appropriate therapy for the endocarditis. On the Ultrasound images, note the vegetation attached to the AV leaflets protruding into the LVOT. Here we are again! Drum roll for August’s Ultrasound of the Monthaward, which goes to Dr. Ryan Rees! Please see the fellows for your prize. This patient was a 62 y/o male who presented with new flashers and floaters of the right eye. Visual acuity in the affected eye was 20/70. Dr. Rees astutely grabbed the ultrasound machine, selected the linear probe, adjusted the depth perfectly, and then cranked up the gain appropriately to get a good view into an otherwise deeply anechoic vitreous space. Clip 1 reveals a mobile hyperechoic tissue band that appears to be anchored laterally and floats above the back of the eye. Extraocular movements cause the band to “wiggle” after the eye has finished moving – a phenomenon called “after movement”. Choroidal detachment will look similar but will have very limited after movement. You’ll notice also in Clip 1 that the optic nerve is mostly not visible. The main differential diagnosis for clip 1 is retinal detachment vs. vitreous detachment (which can appear almost identical). The key differentiating factor is that thevitreous detachments do not necessarily anchor to the optic nerve and will exhibit fairly dramatic after movement for that reason (image below for reference). Clip 2 shows the retina peeling of just lateral to the optic nerve, thereby illustrating one ofthe key anchor points that help make the final diagnosis of retinal detachment. The other anchor “point” for the retina is the ora serrata (anterior margin of the retina that interfaces with the ciliary bodies).
Keep the interesting (and high quality) scans coming! Your Ultrasound Fellows, Ian and Alek Welcome to another academic year!
As your new US fellows, along with the Ultrasound Division, we would like to continue the Dr. Greenstein tradition of Ultrasound of the month. Thanks to everyone for the great ultrasound images this past month - it was truly a challenge to pick the single best image of the month. The Ultrasound of the month winner for July is Dr. Kaitlin Parks. Please see the fellows for your prize! Dr. Parks had a great pick up of a type B aortic dissection on a patient with ESRD, HTN and a known pericardial effusion who presented with chest pain after a missed dialysis session. Dr. Parks very appropriately performed a cardiac ultrasound. After imaging the IVC, she noted an irregularity in the descending aorta, consistent with a dissection flap, prompting her to order a dissection protocol CT. The CT confirmed the presence of a type B dissection originating at the distal margin of the left subclavian artery, terminating just superior to the origin of the SMA. The patient was admitted to the ICU and was medically managed. The ultrasound clip below clearly demonstrates a mobile dissection flap within the lumen of the aorta. The image appears to show the dissection flap terminating at the origin of the SMA (as read on the CT scan). CT scan image showing the type B dissection - note that the celiac trunk is supplied by the false lumen! Keep up the great work! Your Ultrasound Fellows, Ian and Alek |
AuthorWash U EM Ultrasound Faculty and Fellows Archives
July 2025
Categories |

RSS Feed